
Note: All data is mock and does not represent real production figures. Confidential details have been removed.
INDEED INNOVATION GmbH
Connectivity:
Wellness Lifestyle App Suite
Product Format: Web application (Responsive)
Project Year: 2022 – Present
Business Partner: VW Group Procurement
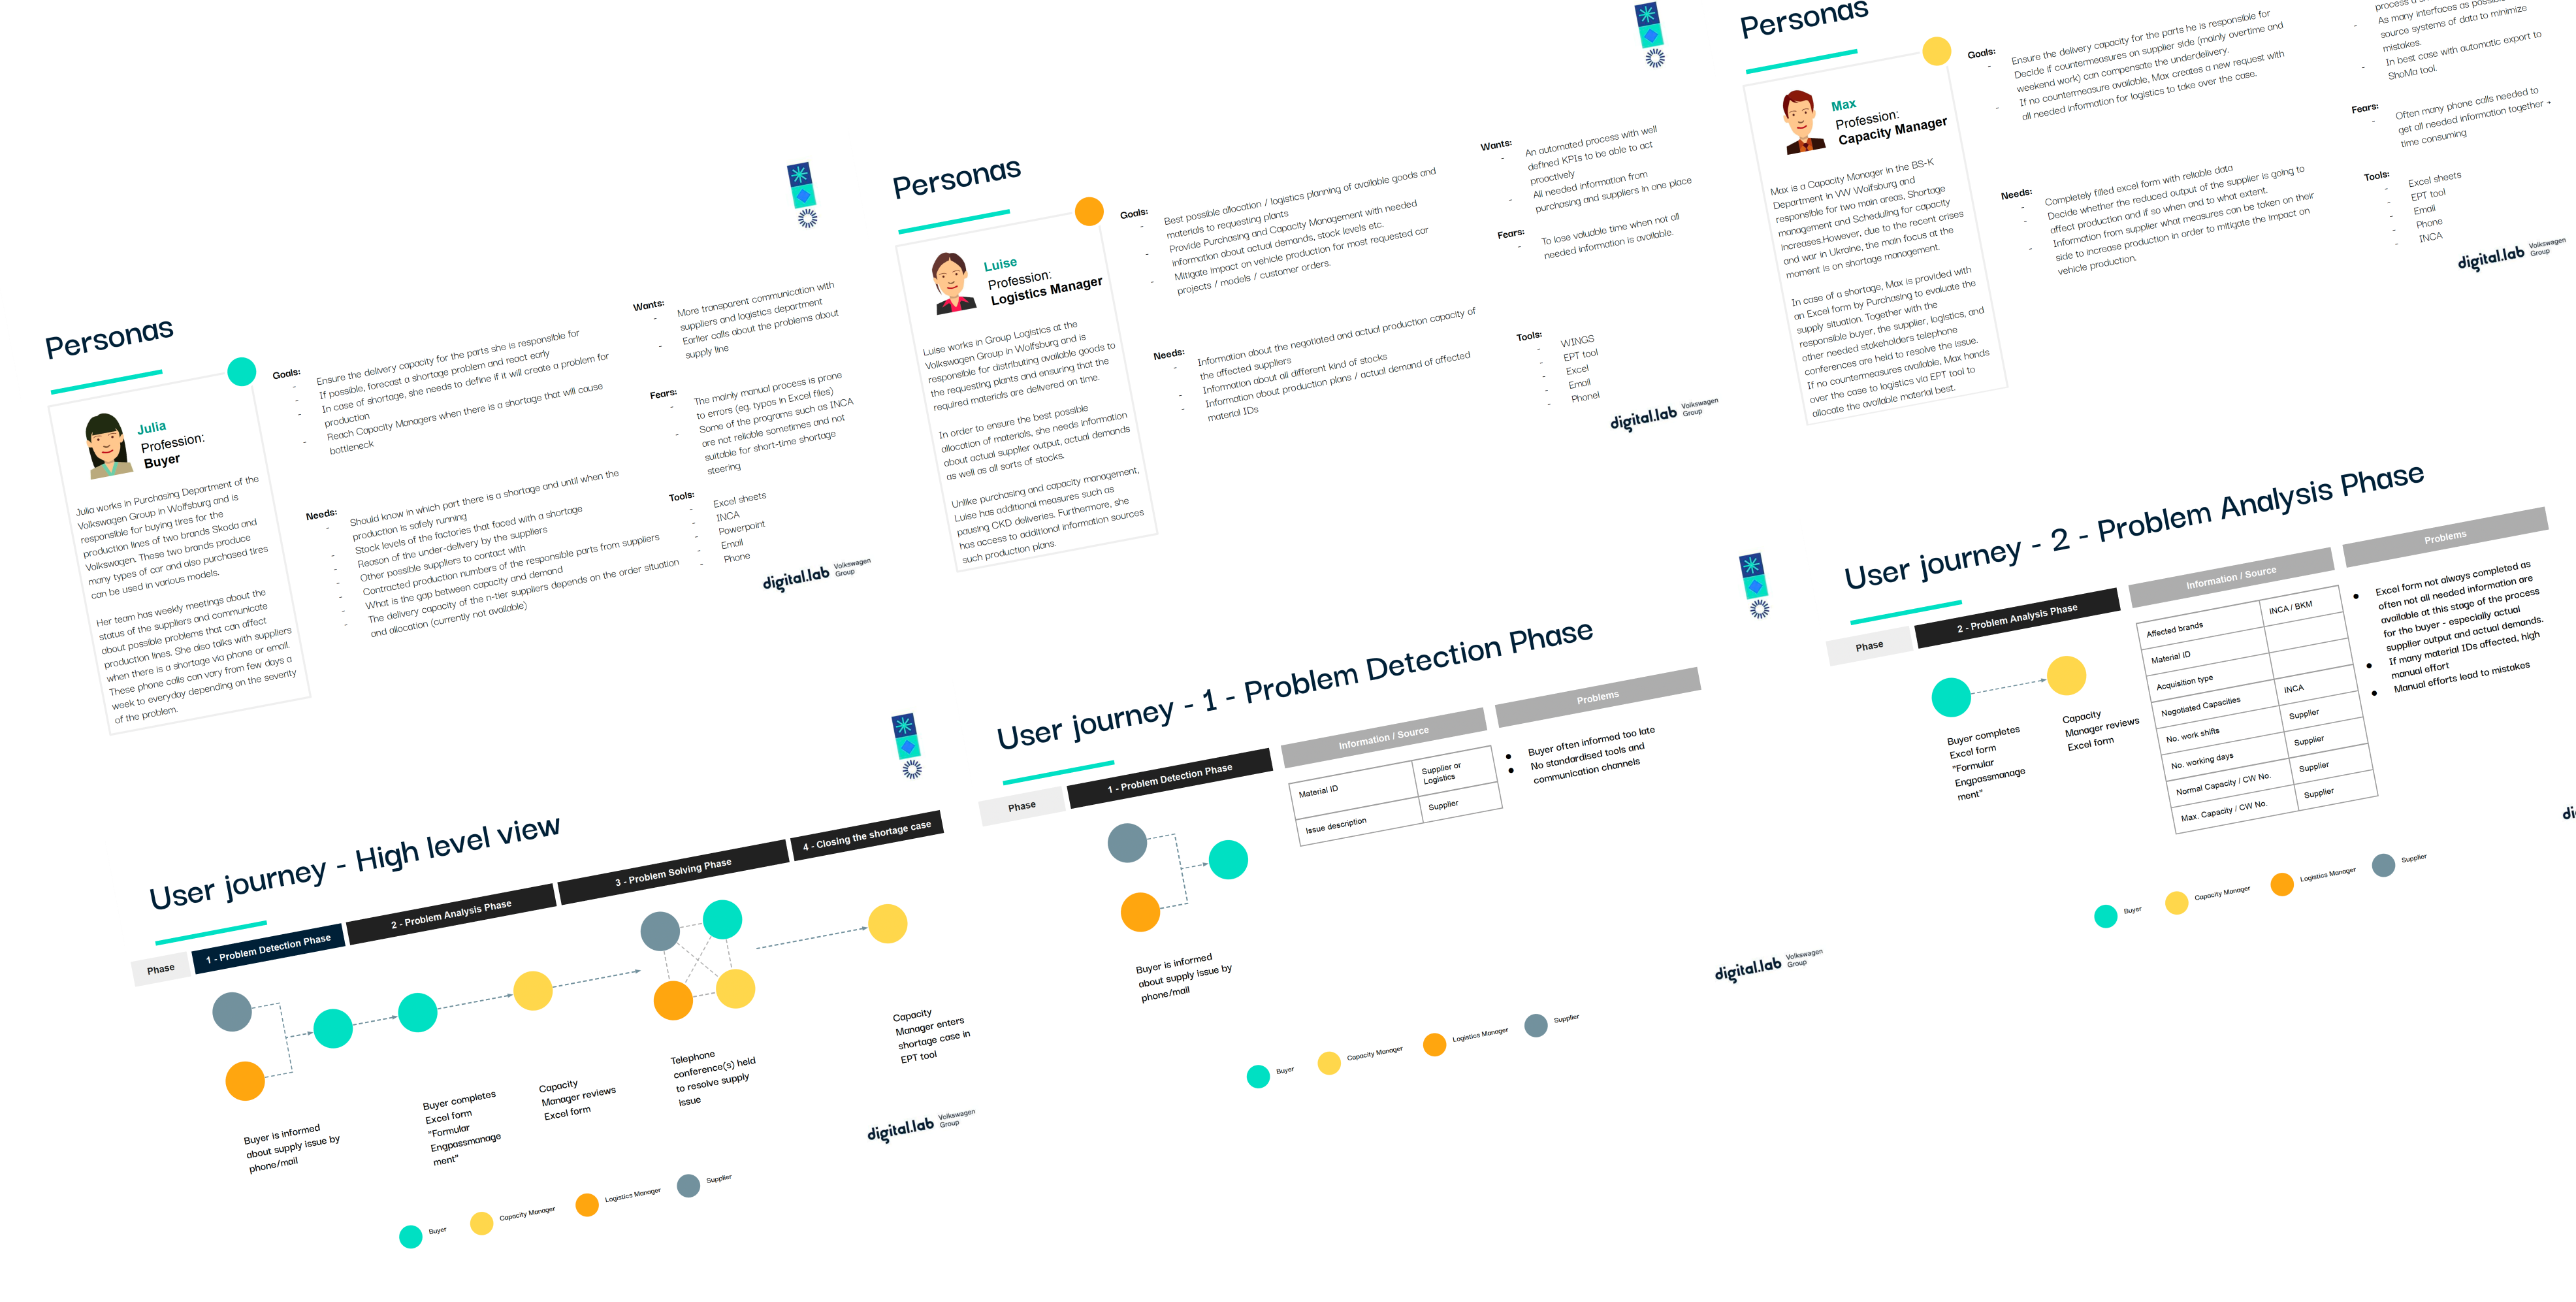
Field research & user workshop
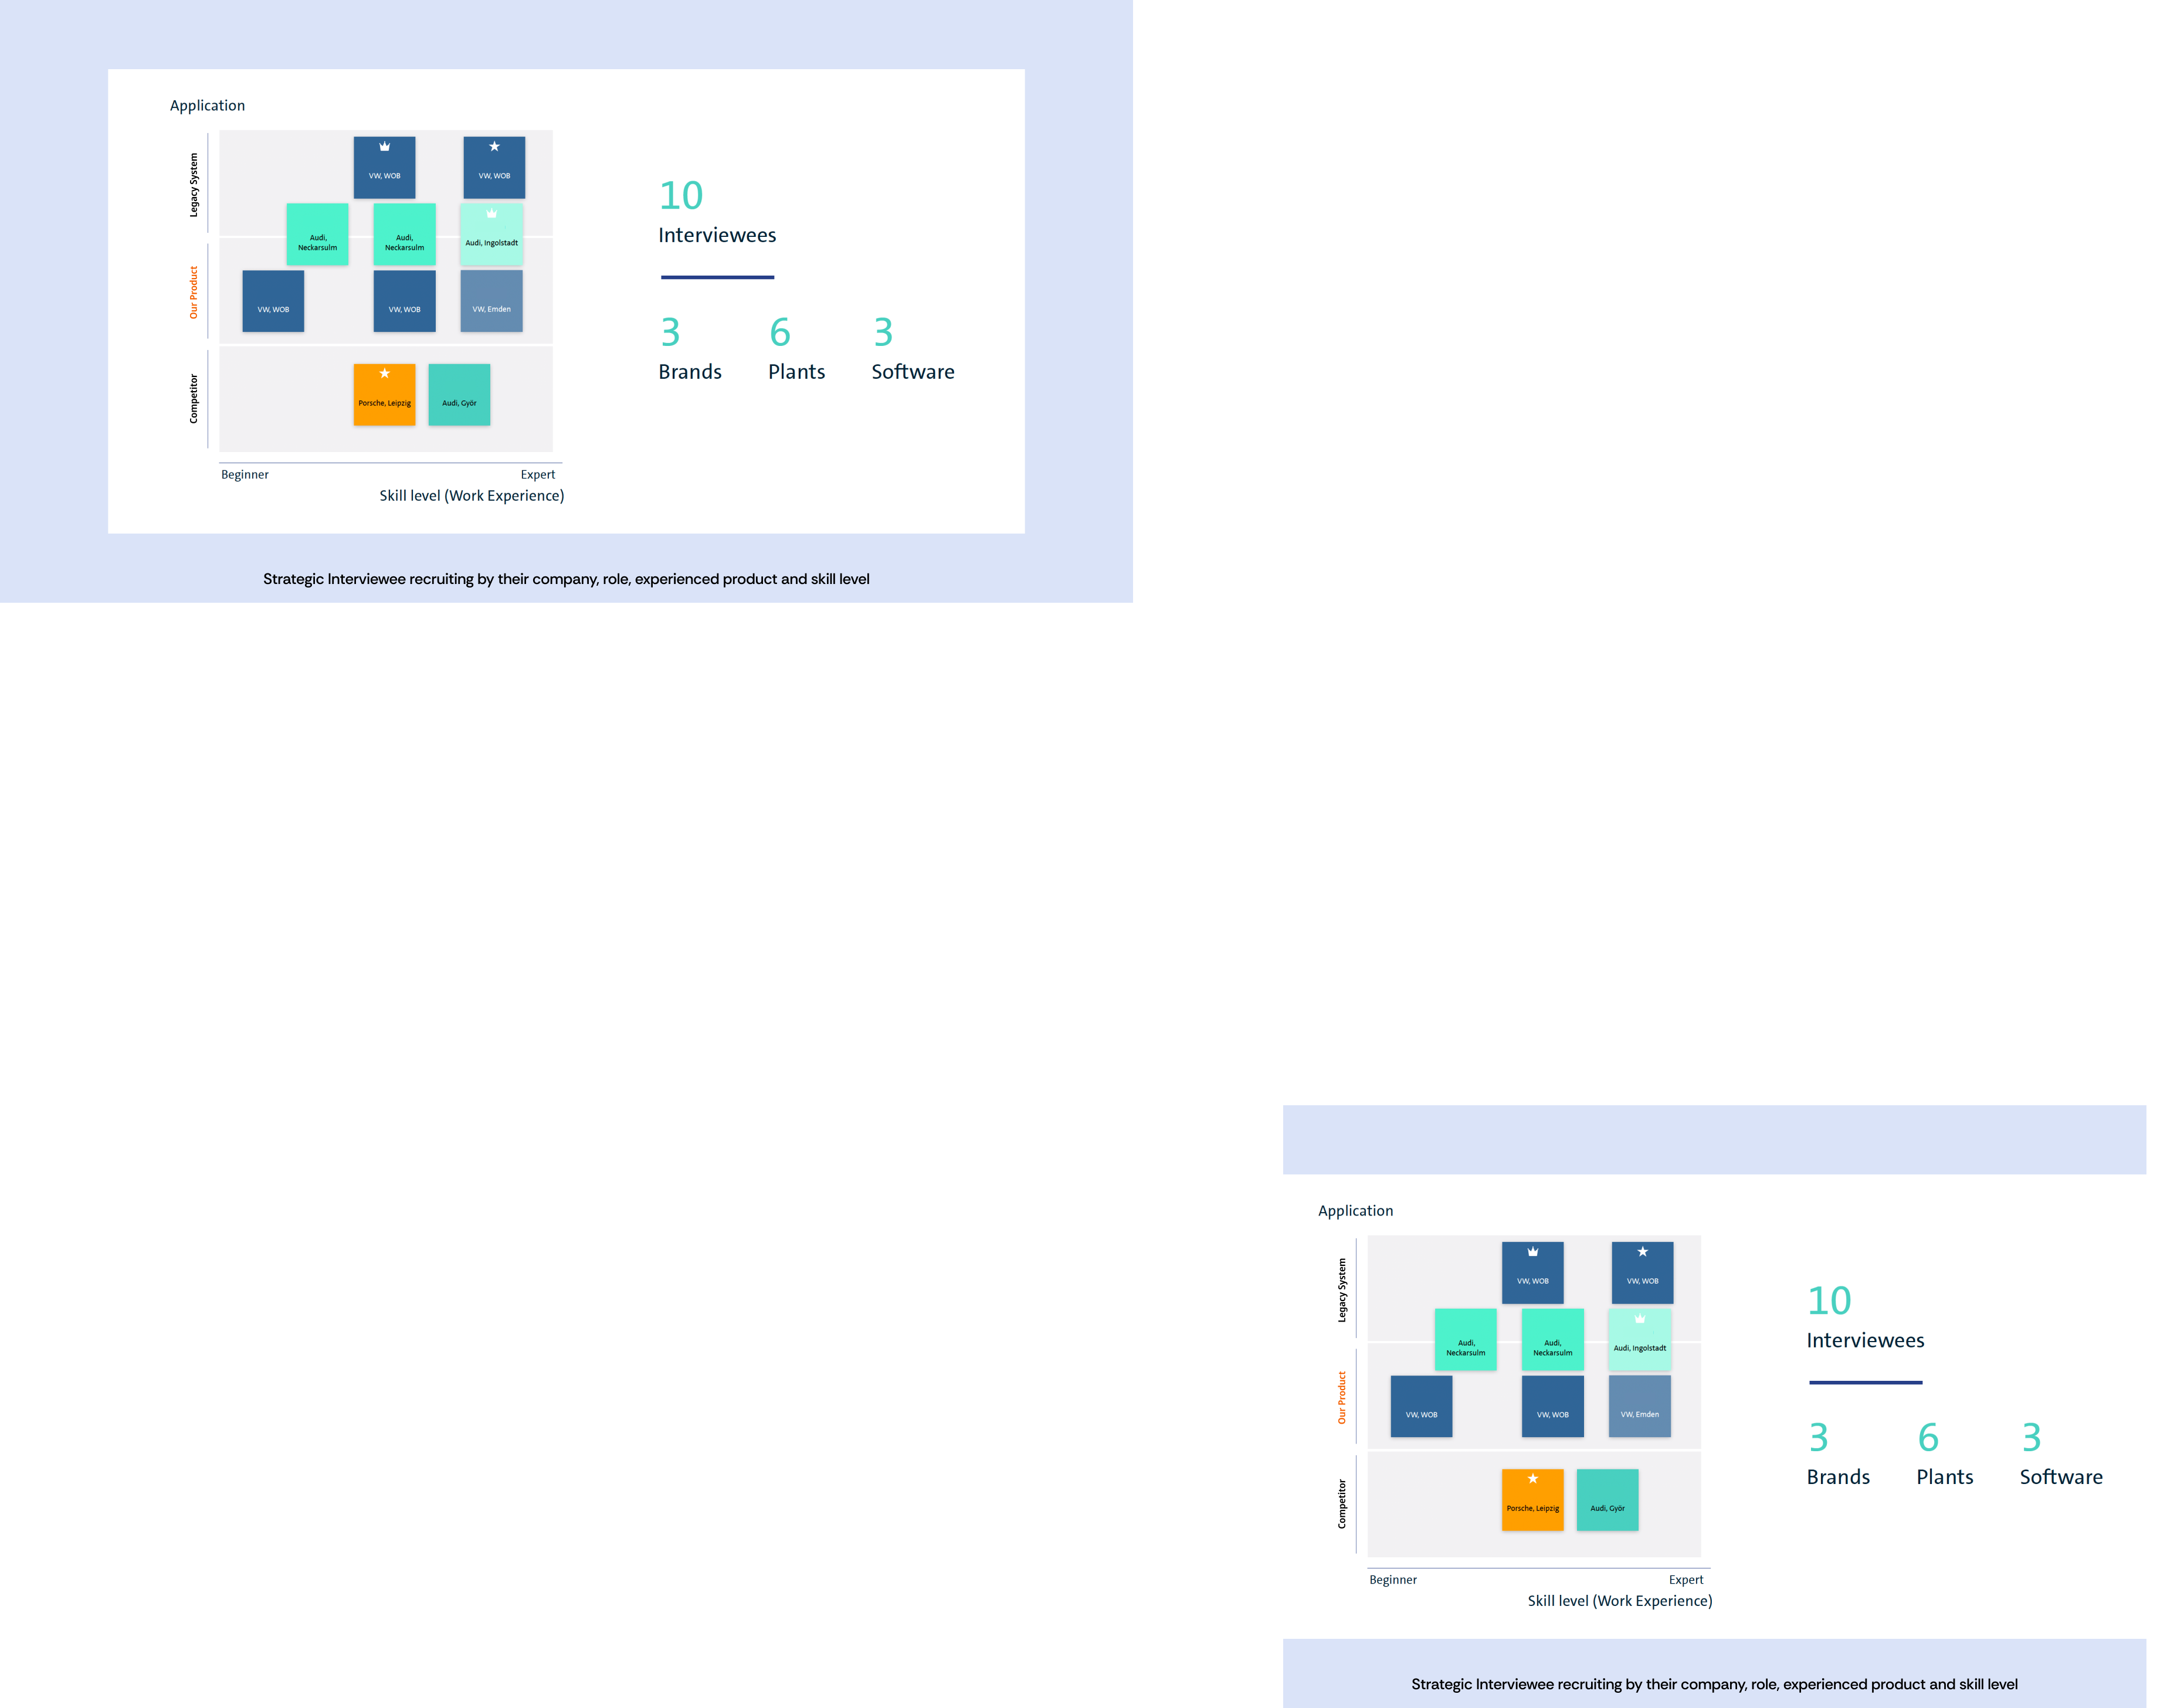
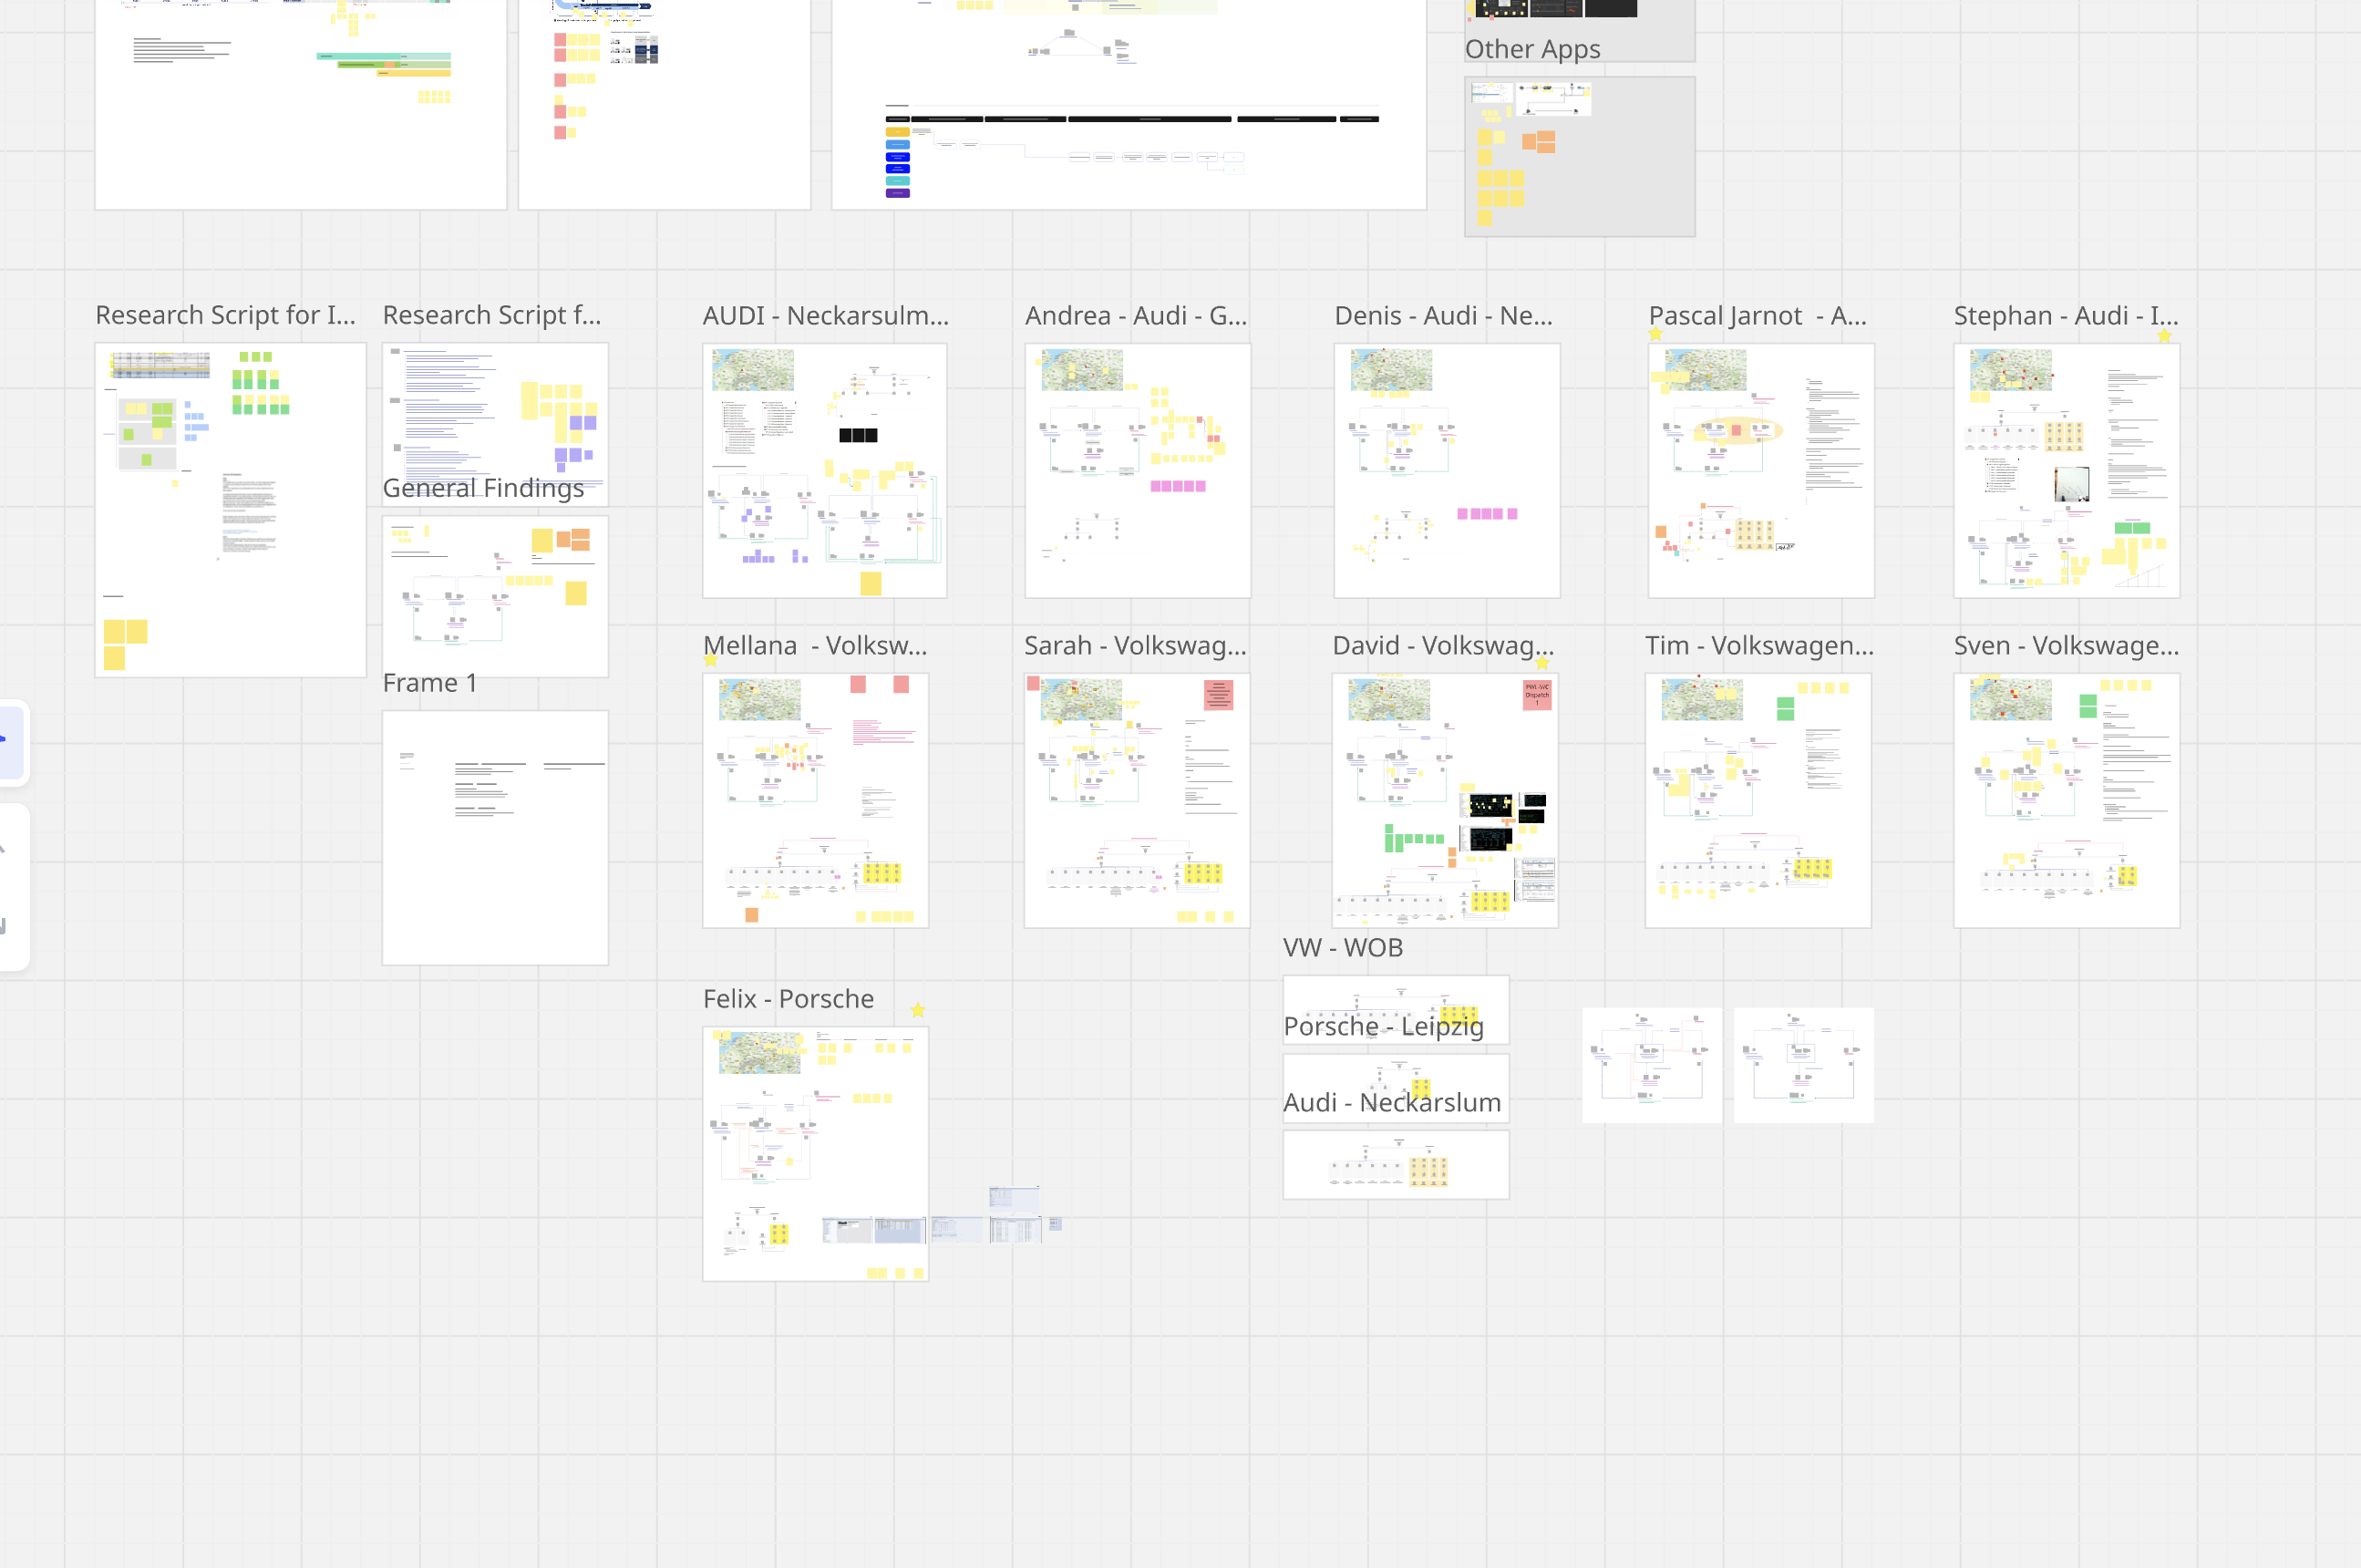
To gather diverse insights, we intentionally brought in 10 users from different roles, brands, plants, and skill levels, each using different tools in their daily work.
We interviewed them and shadowed their workflows over three days. Afterwards, we sat down with them and mapped their work processes, organisational structures, and reporting systems together in Miro.
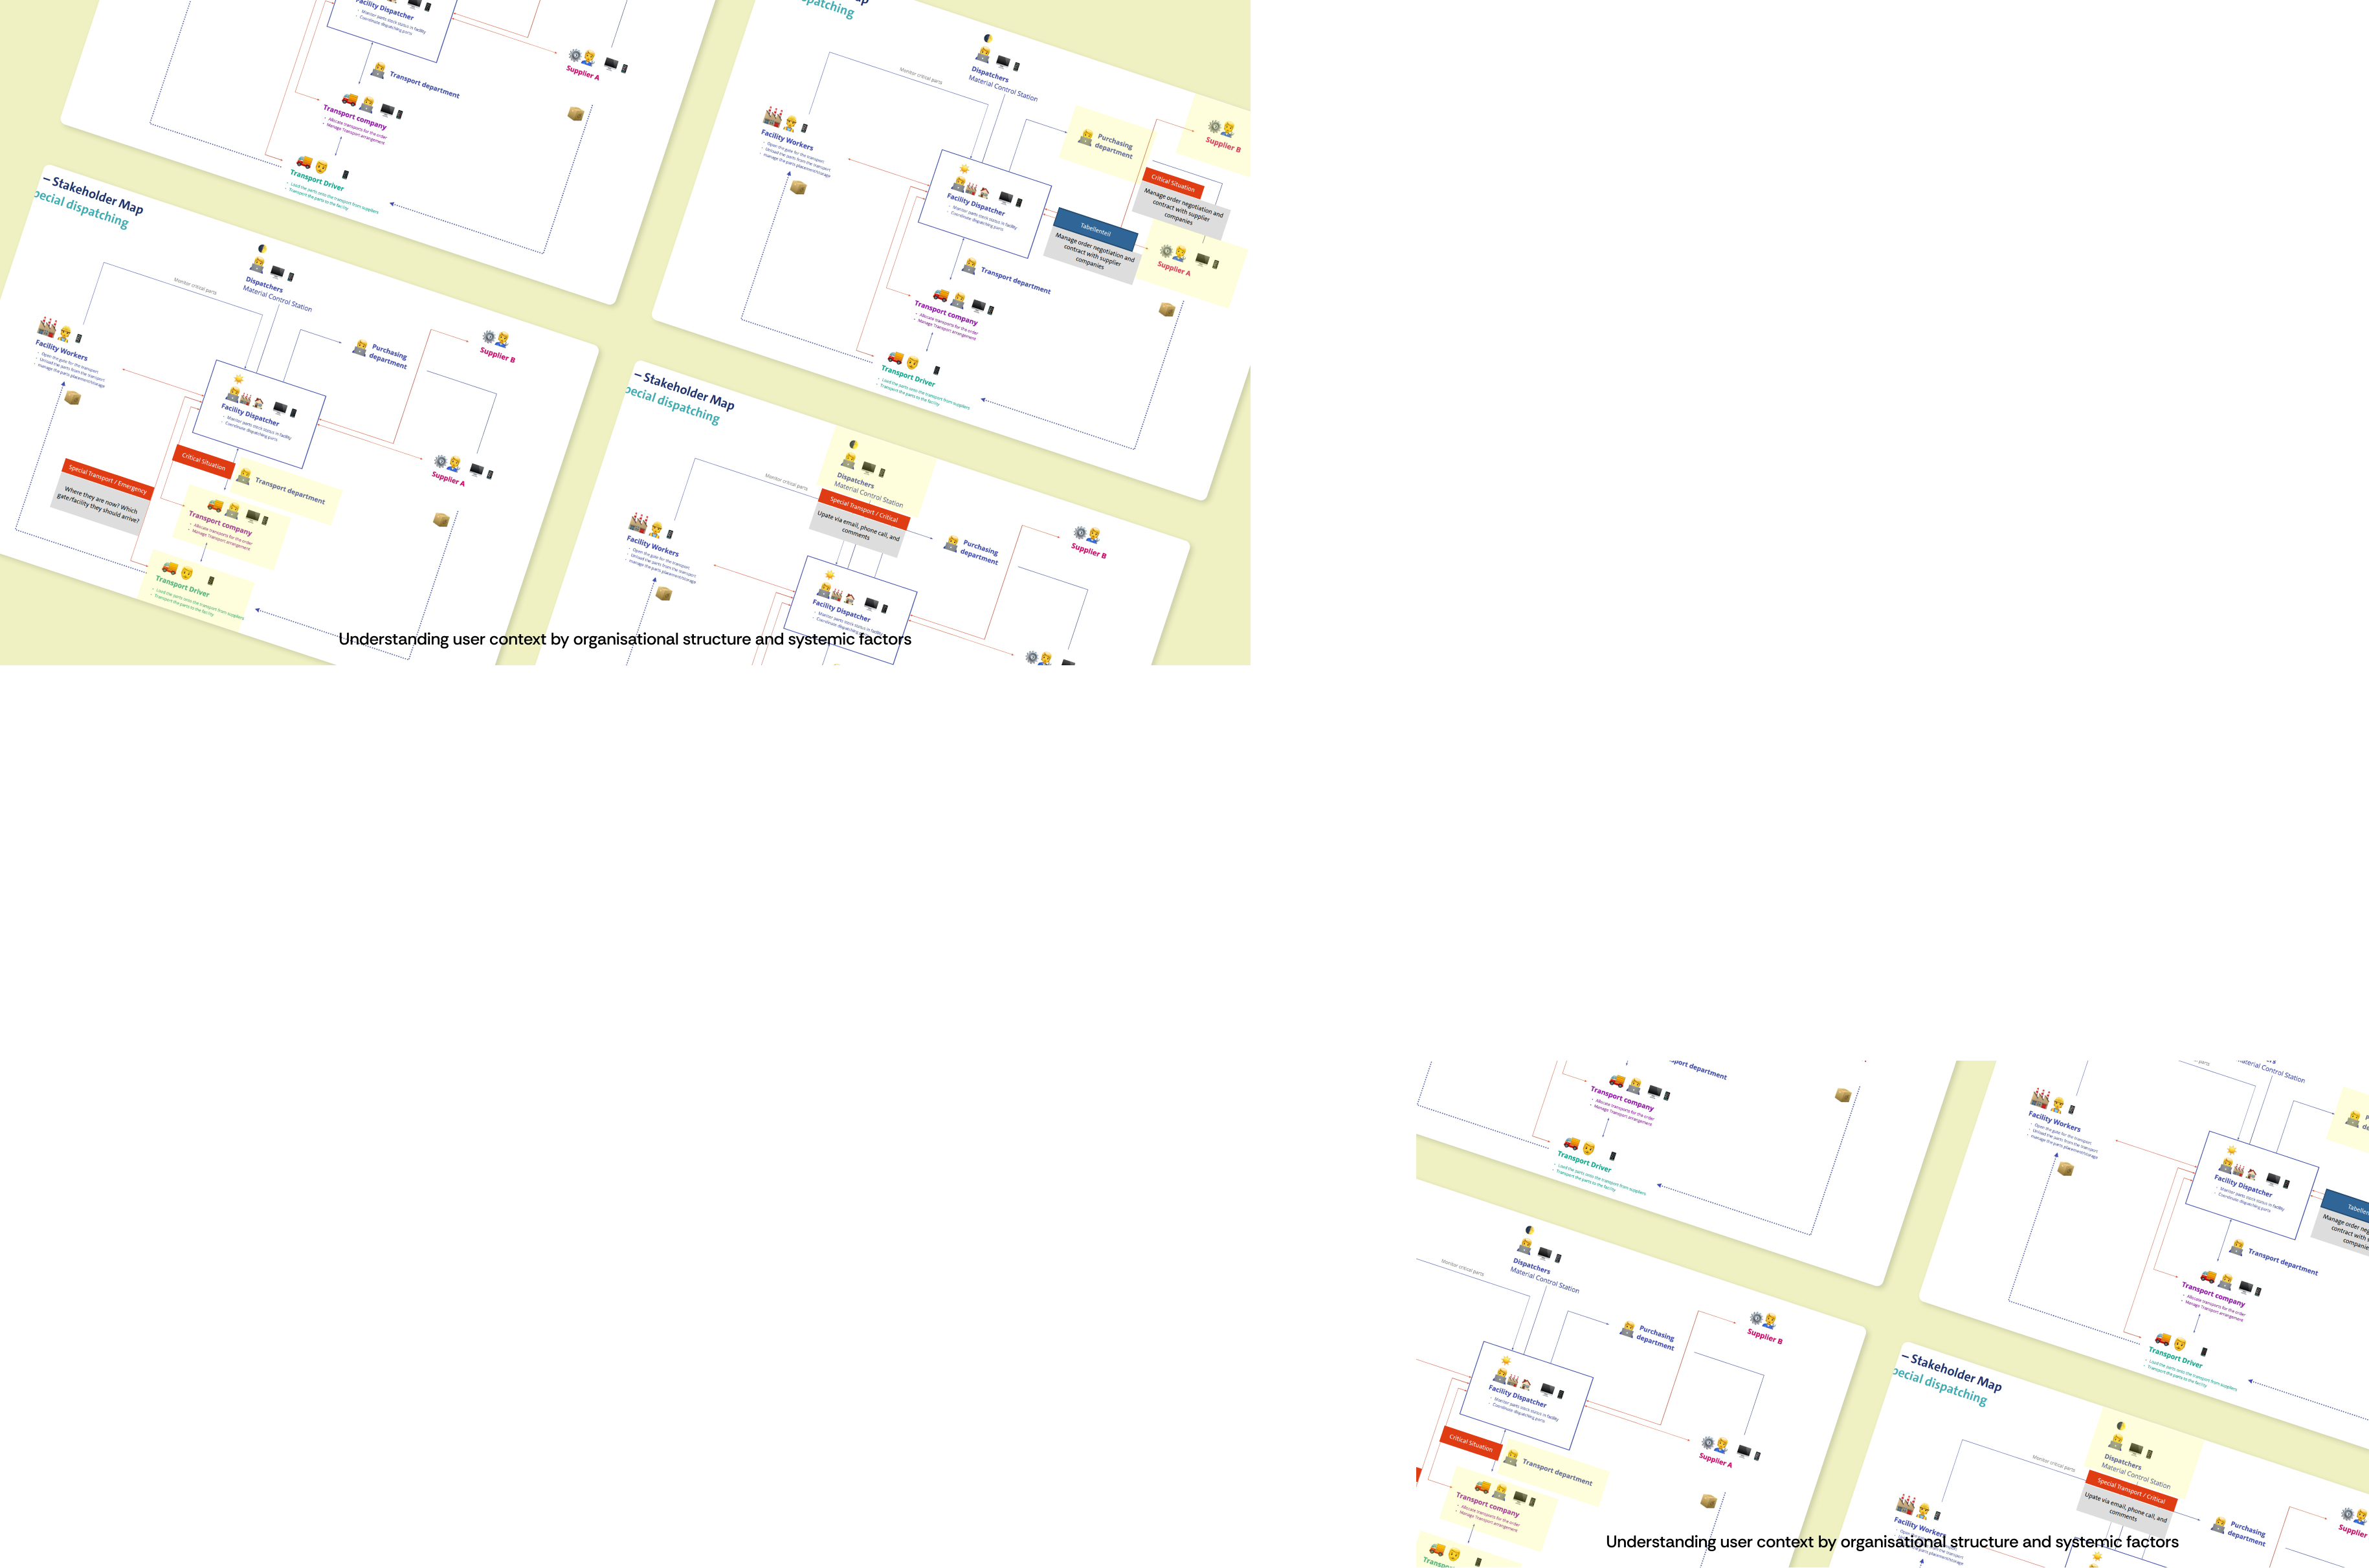
Stakeholder mapping
Challenge & Opportunities
Challenge 1
Cognitive Overload: All information on one page creates distraction and prevents effective shortage identification
Challenge 2
Tool Carnivalism: Disconnected systems for shortage identification, problem solving, and reporting create silos and internal cannibalization
Challenge 3
Supply Chain Blind Spots: Missing external supplier information and tier relations obscure 80% of shortage root causes
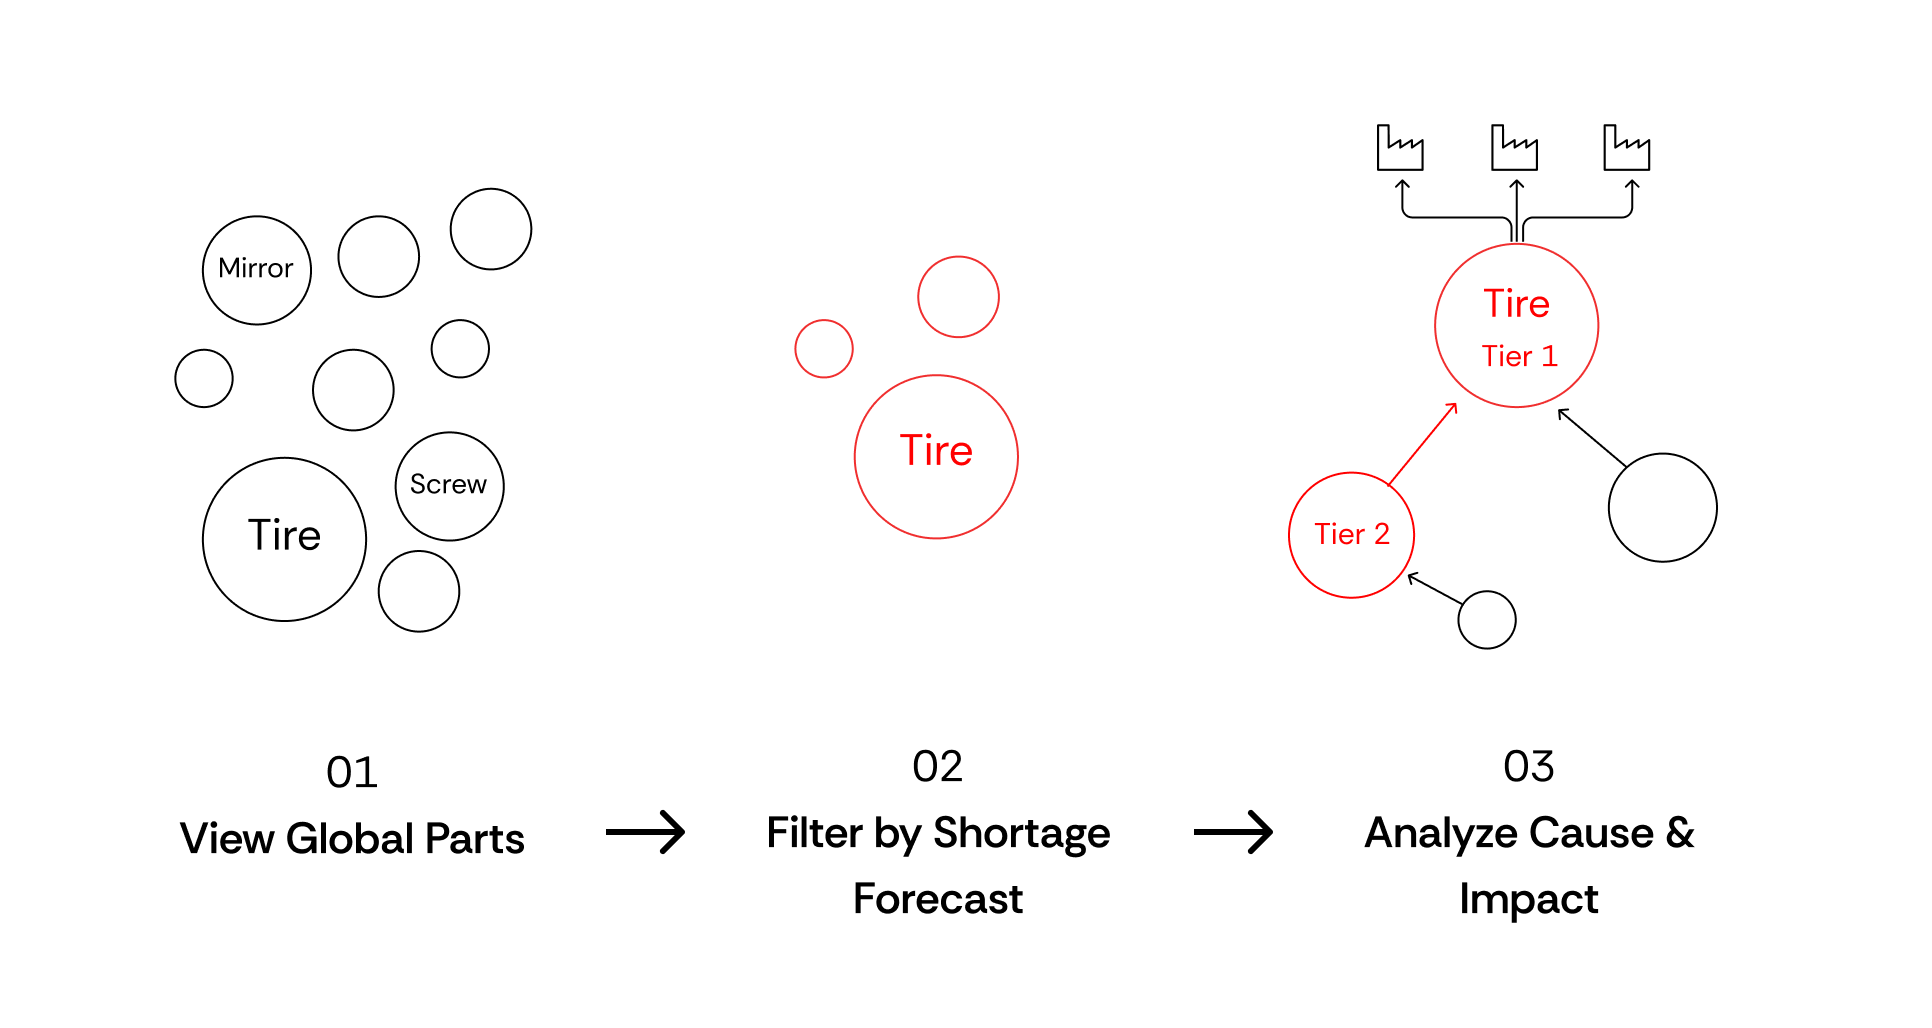
Opportunity 1
Staged Information Diet: Divide workflow into three digestible pages—Global overview, Part details, and Bottleneck management
Opportunity 2
Ecosystem Orchestration: Provide API bridges to specialized tools instead of building everything, enabling seamless cross-platform workflows
Opportunity 3
N-tier Graph: Use graph visualization to reveal hidden part-specific supply chain relationships with BOM data
Focus usecase
Figma → Phrase → Code
In collaboration with the development team, I defined a consistent naming convention. Keys were created and maintained by designers in context, enabling a seamless design-to-development workflow and significantly reducing developer time spent searching for the correct key-value pairs.
Business Impact
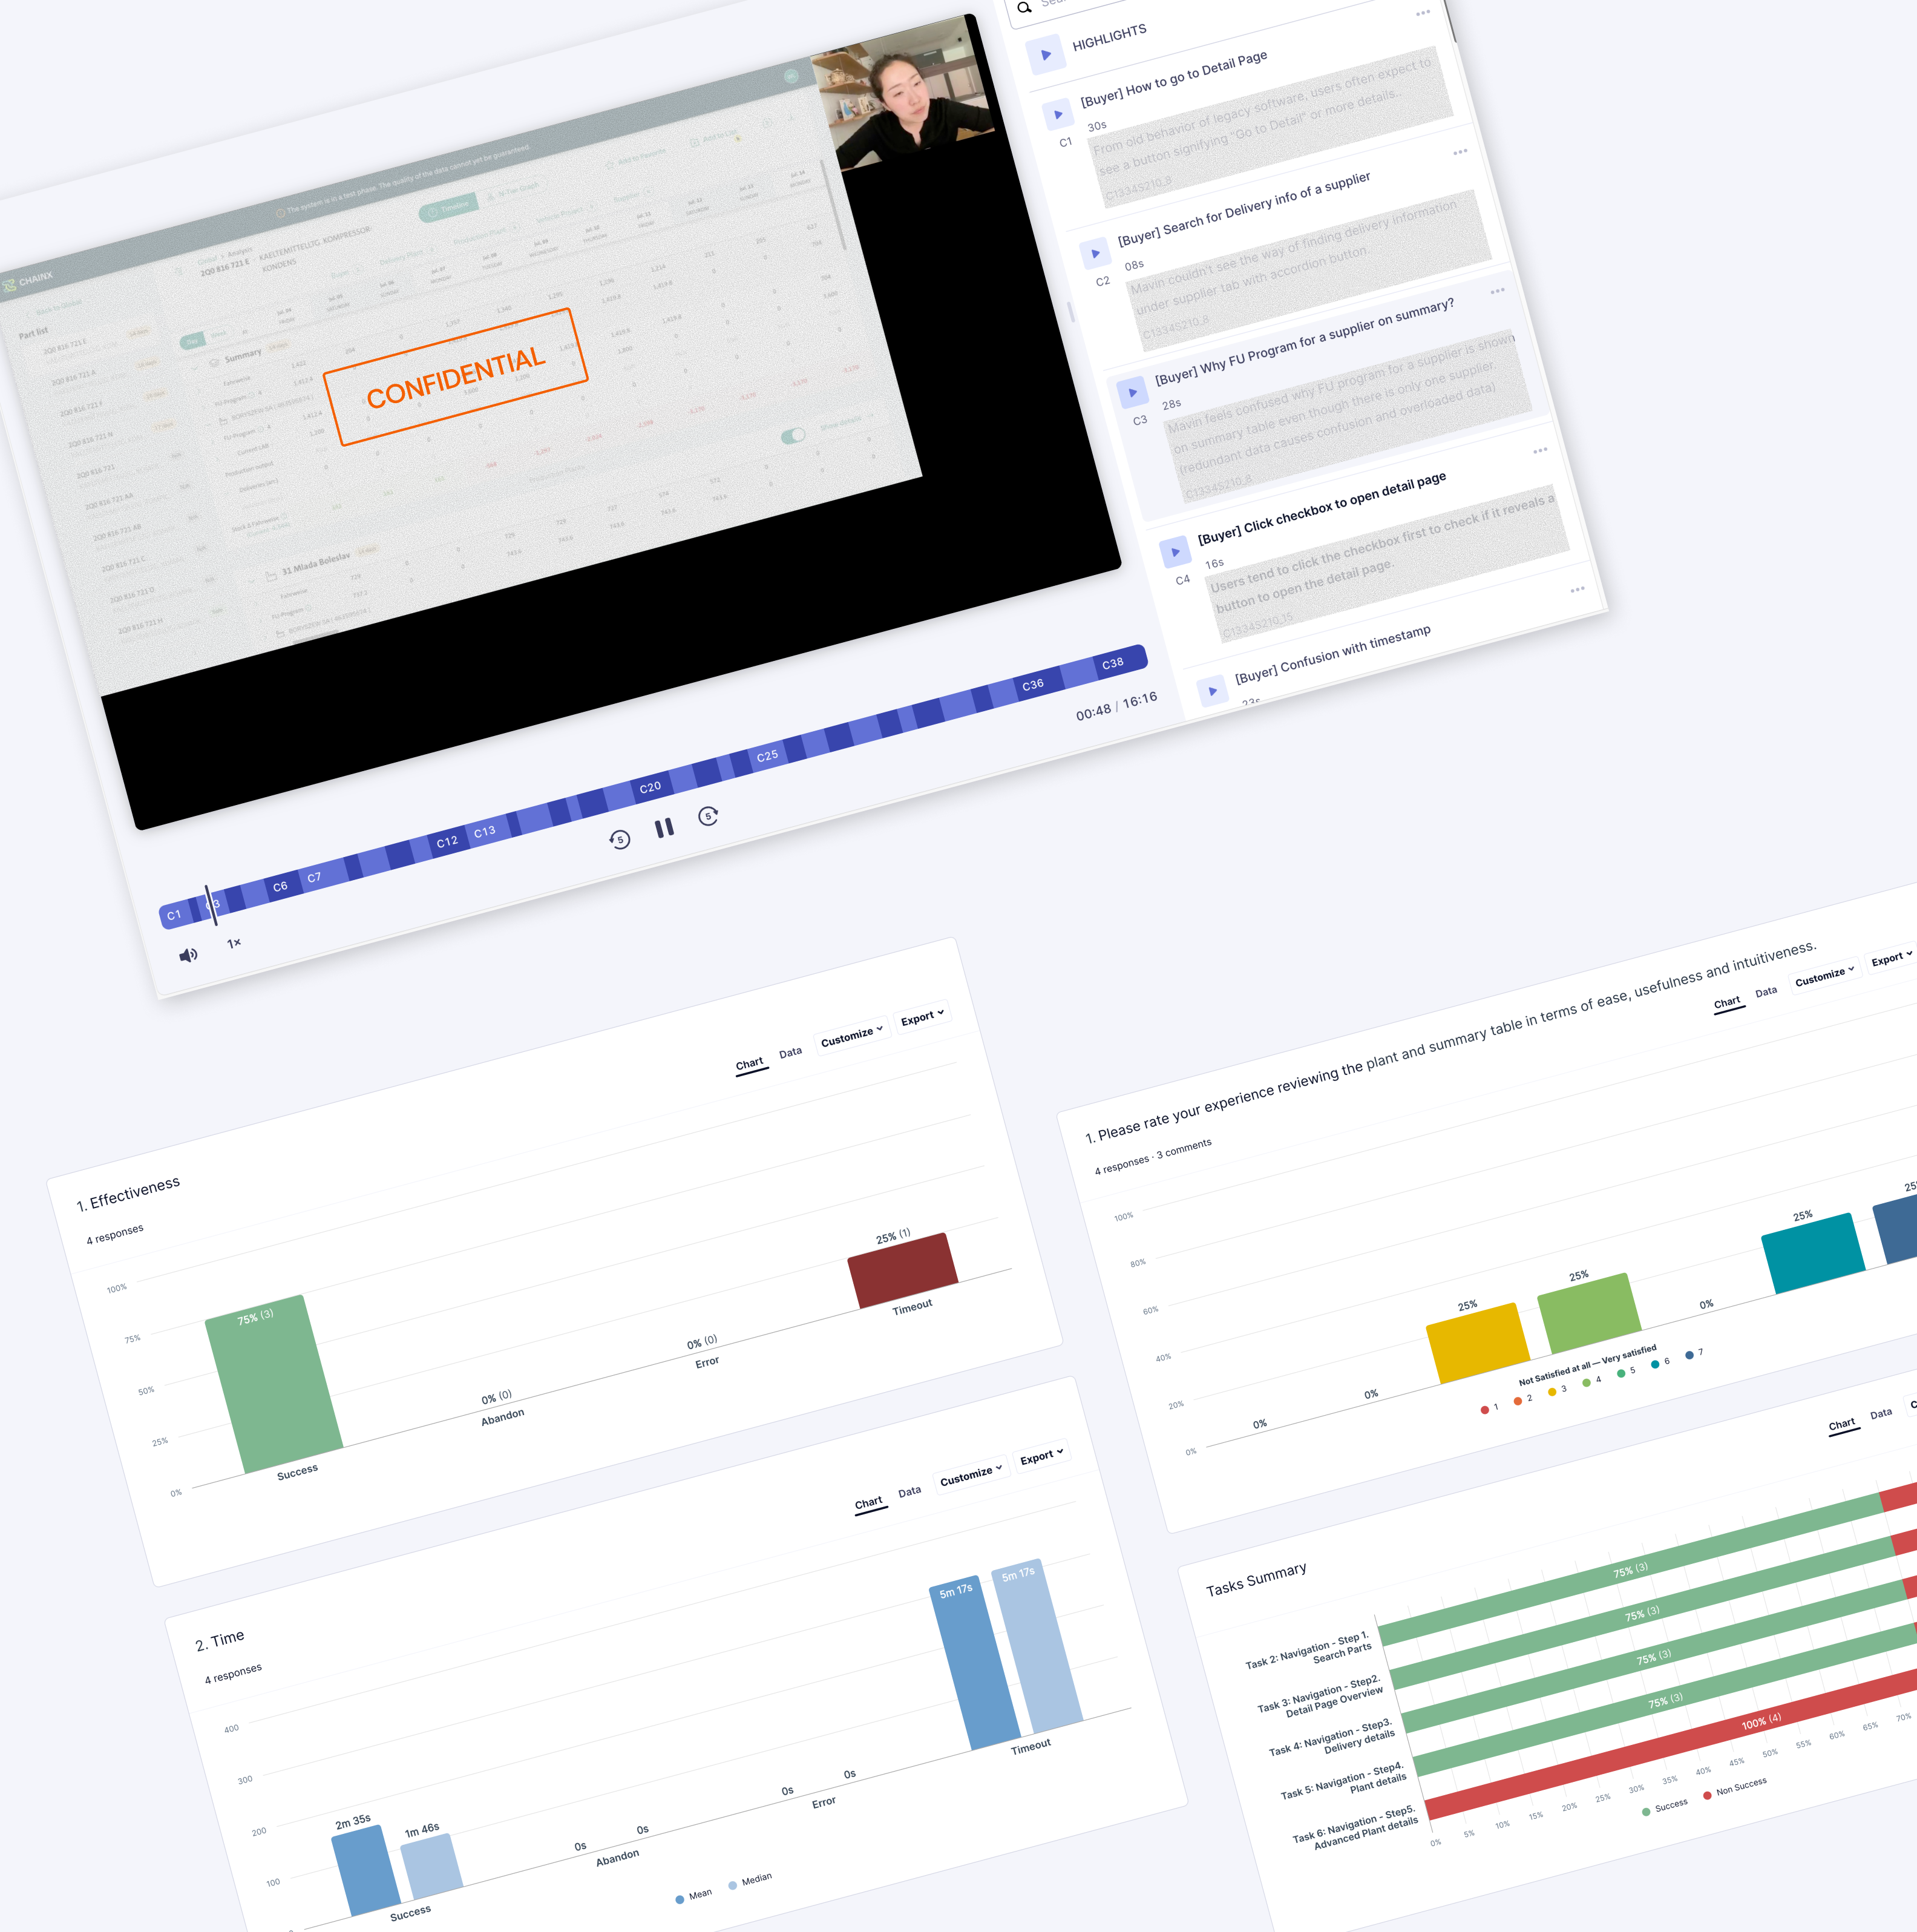
⏱️ Task completion time dropped from 12 mins 29seconds to 6 seconds for critical flows (e.g. finding Shipment note number)
Stakeholder Impact
👥 8000+ users onboarded across plants of 6 brands (Audi, SEAT, Skania, Porsche, VW, Skoda) with consistently positive adoption feedback
Organisational Impact
📜 As a new standard
The user insights and customer journey we explored and defined have since been adopted by other teams as organizational UX standards.
“
I didn't think a tool like this could exist here. It feels like it was made by someone who actually understands my day.

All Rights Reserved

Note: All data is mock and does not represent real production figures. Confidential details have been removed.
INDEED INNOVATION GmbH
Connectivity: Wellness Lifestyle App Suite
Product Format: Web application (Responsive)
Project Year: 2022 – Present
Business Partner: VW Group Procurement
Field research & user workshop
To gather diverse insights, we intentionally brought in 10 users from different roles, brands, plants, and skill levels, each using different tools in their daily work.
We interviewed them and shadowed their workflows over three days. Afterwards, we sat down with them and mapped their work processes, organisational structures, and reporting systems together in Miro.
Stakeholder mapping
Challenge & Opportunities
Challenge 1
Cognitive Overload: All information on one page creates distraction and prevents effective shortage identification
Challenge 2
Tool Carnivalism: Disconnected systems for shortage identification, problem solving, and reporting create silos and internal cannibalization
Challenge 3
Supply Chain Blind Spots: Missing external supplier information and tier relations obscure 80% of shortage root causes
Opportunity 1
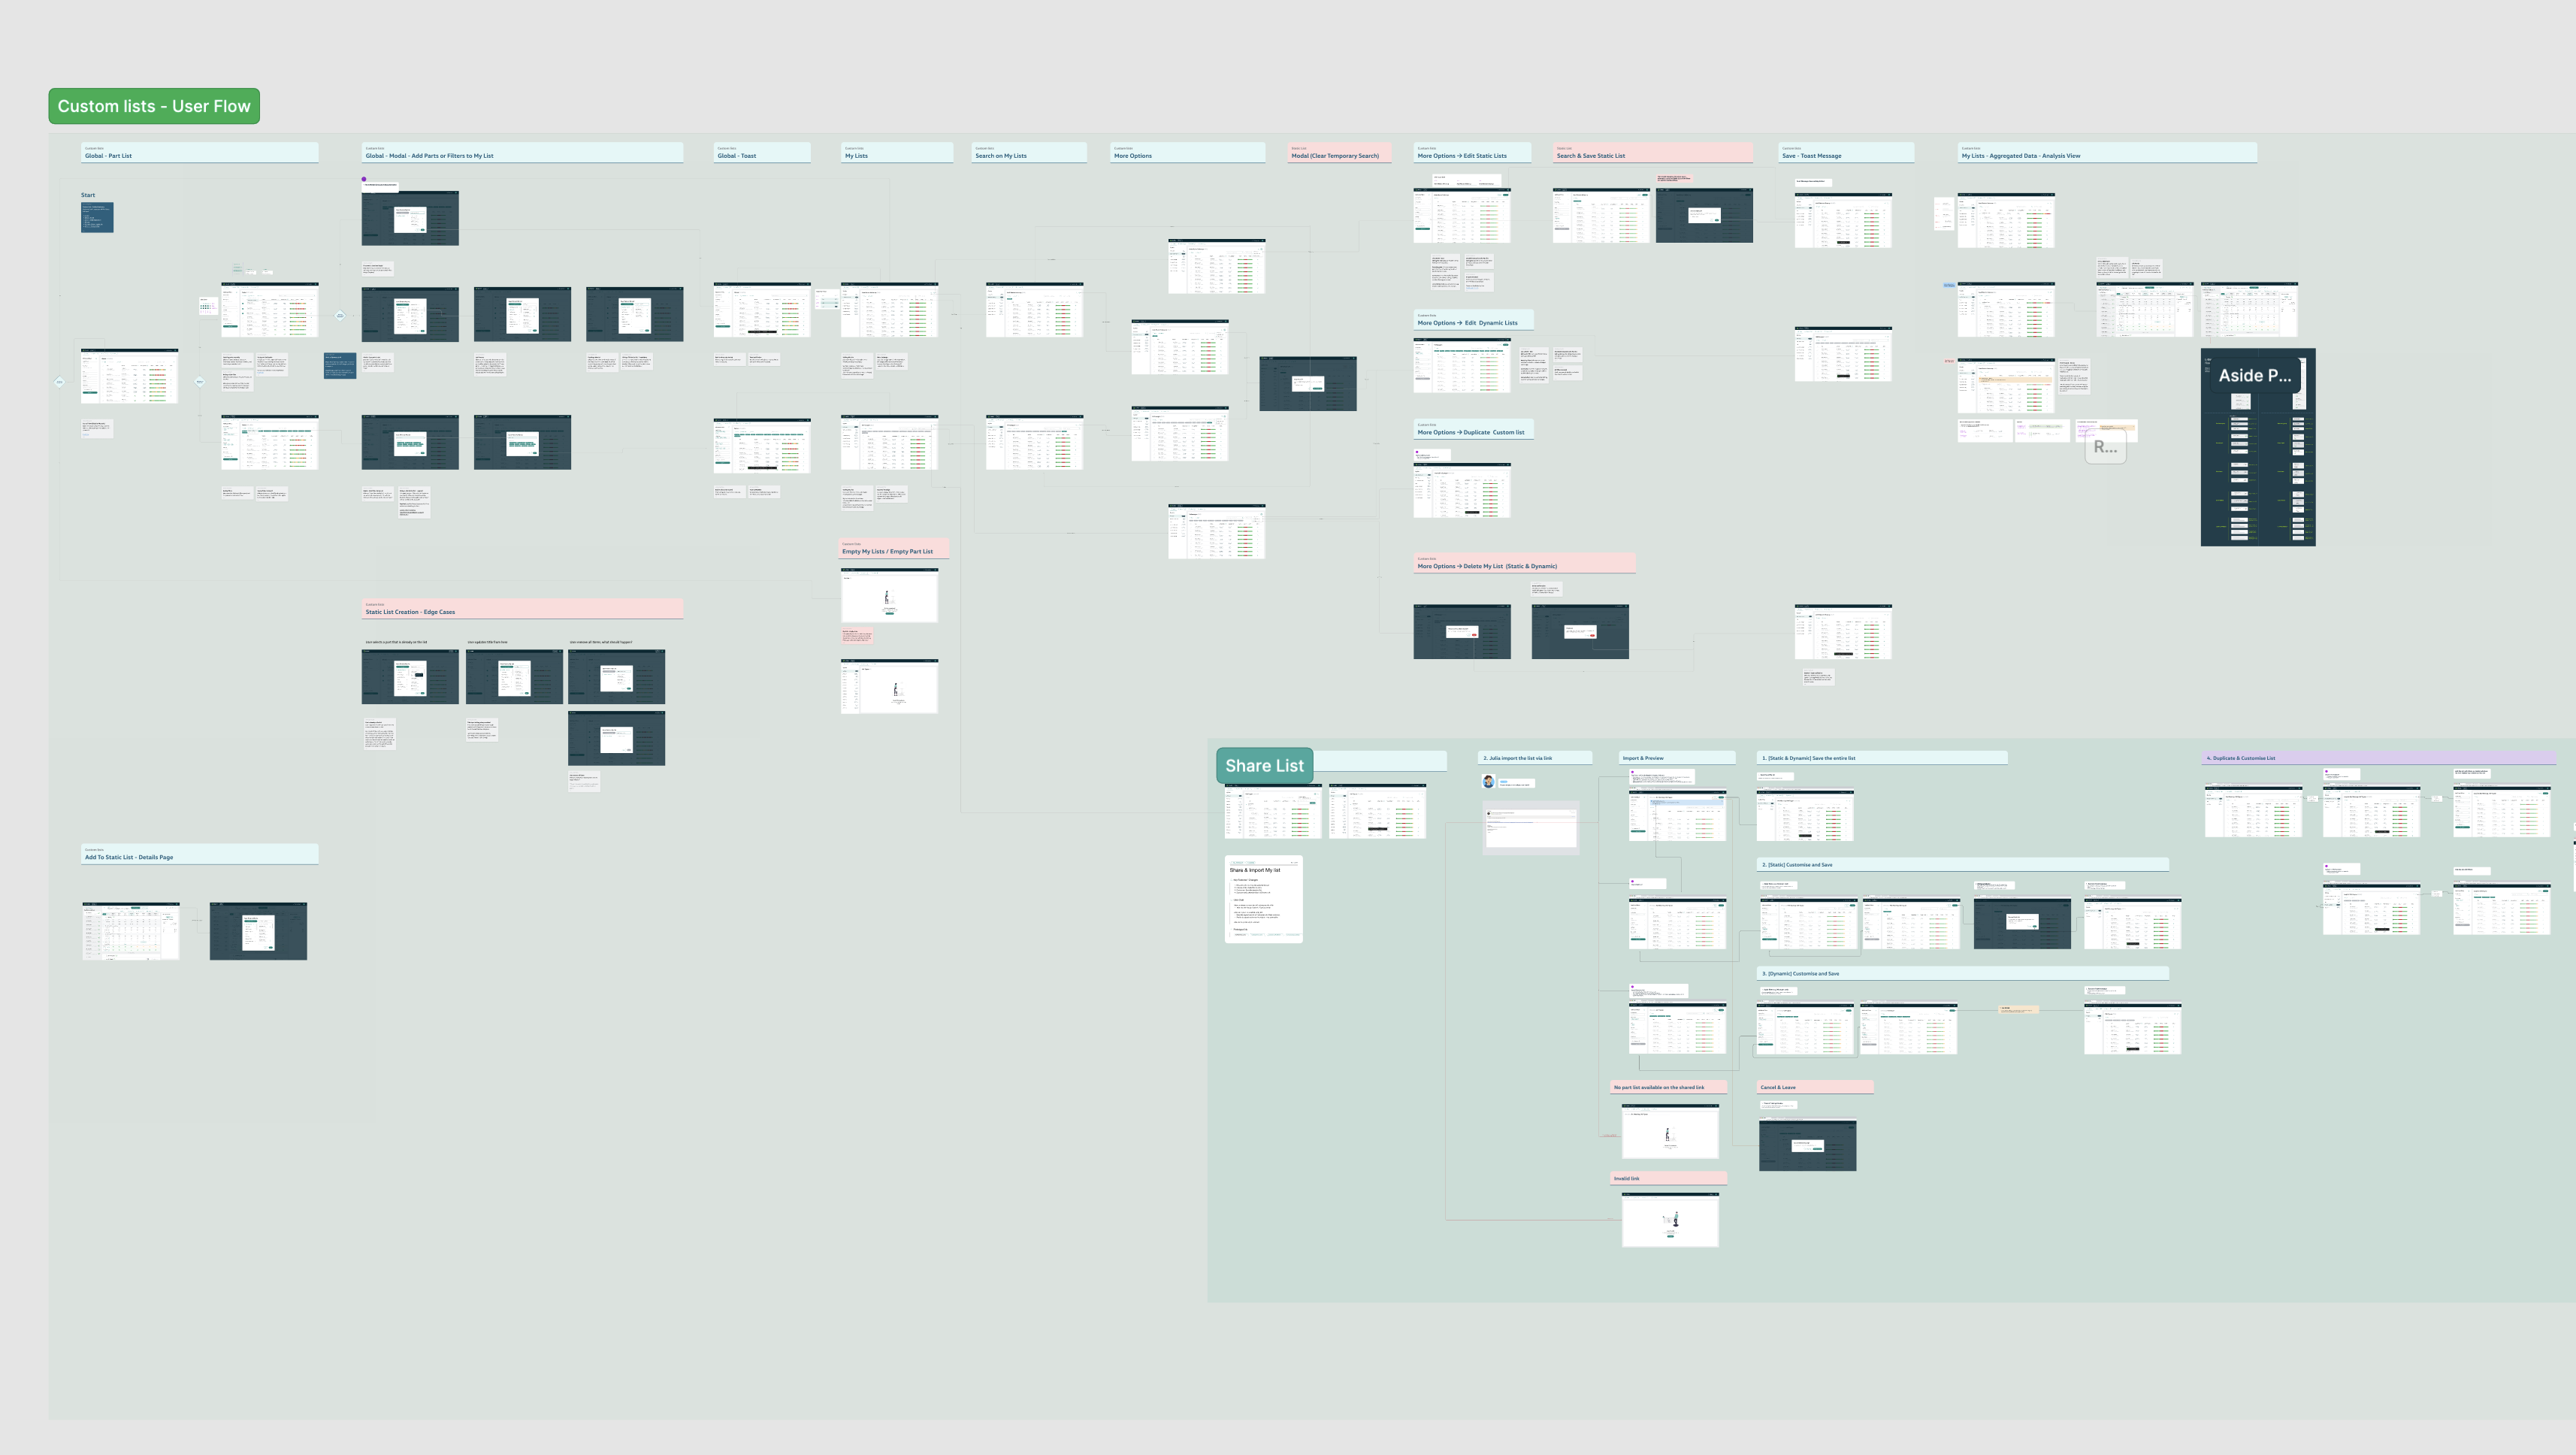
Staged Information Diet: Divide workflow into three digestible pages—Global overview, Part details, and Bottleneck management
Opportunity 2
Ecosystem Orchestration: Provide API bridges to specialized tools instead of building everything, enabling seamless cross-platform workflows
Opportunity 3
N-tier Graph: Use graph visualization to reveal hidden part-specific supply chain relationships with BOM data
Focus usecase
Figma → Phrase → Code
In collaboration with the development team, I defined a consistent naming convention. Keys were created and maintained by designers in context, enabling a seamless design-to-development workflow and significantly reducing developer time spent searching for the correct key-value pairs.
Business Impact
⏱️ Task completion time dropped from 12 mins 29seconds to 6 seconds for critical flows (e.g. finding Shipment note number)
Stakeholder Impact
👥 8000+ users onboarded across plants of 6 brands (Audi, SEAT, Skania, Porsche, VW, Skoda) with consistently positive adoption feedback
Organisational Impact
📜 As a new standard
The user insights and customer journey we explored and defined have since been adopted by other teams as organizational UX standards.
“
I didn't think a tool like this could exist here. It feels like it was made by someone who actually understands my day.
All Rights Reserved